The FORECAST.ETS.SEASONALITY function is a Statistical function that predicts the length of the season in a repetitive pattern, for a given specified time series. The function returns the same season length which is calculated by the FORECAST.ETS function automatically. Thus, you can use this function to see what seasonality is calculated by Excel. In this guide, we’re going to show you how to use the FORECAST ETS SEASONALITY function and go over some tips and error handling methods.
Supported versions
- Excel 2016 or newer
- Not supported Excel for the Web, iOS, or Android.
FORECAST.ETS.SEASONALITY Function Syntax
Arguments
| values | The historical values in data points. (y values) |
| timeline | The historical data points (dates). (x values) |
| [data_completion] |
Optional. This determines how Excel treats missing data.
|
| [aggregation] |
Optional. The aggregation method for the values with the same time stamp.
|
FORECAST.ETS.SEASONALITY Function Examples
Default form
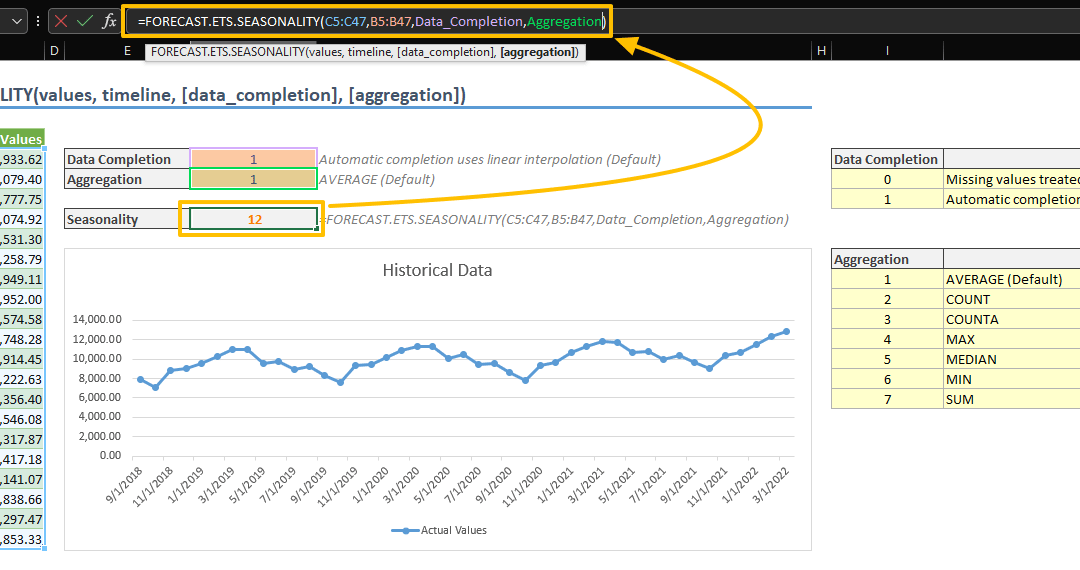
The FORECAST.ETS.SEASONALITY function needs the historical data (values, timeline) to work in its default state. The remaining two arguments are optional.
- values: C5:C47
- timeline: B5:B47

In this form, Excel fills empty cells according to the average of the neighboring points. If there are multiple values on a same data point (date), they are aggregated by calculating the average of those. You can alter each of these assumptions by populating the optional arguments.
Optional arguments
Using optional arguments is related to the dataset and the data origin. If you are in doubt, do not hesitate to try a different combination to find proper options for your data. Here is an example of how different options can alter the predicted values.
In the example below you can see how seasonality differs based on Data Completion and Aggregation combinations.

Remarks
- The FORECAST.ETS.SEASONALITY function supports up to 30% of missing data.
- The date values in the timeline range aren't required to be sorted. However, if a constant step can't be identified in the provided timeline, the function returns #NUM!
- If the timeline range contains duplicate values, FORECAST ETS SEASONALITY will return the #VALUE! error.
- If the ranges of the timeline and values aren't of the same size, the function will return the #N/A
Excel Forecasting Functions
| Forecasting with linear regression | FORECAST.LINEAR |
| Forecasting using Exponential Triple Smoothing | FORECAST.ETS |
| Confidence interval in forecasting using Exponential Triple Smoothing | FORECAST.ETS.CONFINT |
| Statistical values in forecasting using Exponential Triple Smoothing | FORECAST.ETS.STAT |