The VAR.P function is a statistical function that can calculate and return the variance of a population. This formula was essentially introduced as a replacement for the outdated VARP function. Variance provides a general idea of how much data points are spread in a data set, and can be used to calculate the standard deviation or determine the risk of an investment. In this guide, we’re going to show you how to use the VAR.P function and also go over some tips and error handling methods.
Supported versions
- Excel 2010 and newer versions
VAR.P Function Syntax
Arguments
| number1 | The first number corresponding to the entire population. |
| [number2] | Optional. Any other number arguments. Up to 254 can be entered corresponding to a sample of a population. |
VAR.P Function Example
The VAR.P function accepts numeric values as its arguments. Any type of text or logical values will be ignored. You can use range references or static values just like in any other formula.
The function calculates the variance using the following function:

- x: population mean (average)
- x ̅: element of the population
- n: population size
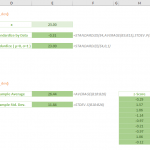
Here is the comparison of the two methods:
The example below uses a formula with the named range sample (B5:B9).

VAR.P Function Tips
- The VAR.P function assumes that its arguments represent the entire population. If your data is a sample of a population, prefer using VAR.S instead.
- The VAR.P function ignores text and logical values like TRUE and FALSE. If you want to evaluate text values and FALSE as 0 and TRUE as 1, use the VARPA function instead.
- Empty cells are ignored.
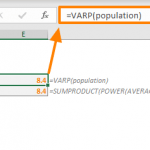
- In most cases, we recommend using the VAR.P instead of the outdated VARP function.
Issues
- Any error in the arguments will cause the function to return an error.