The VAR.S function is a statistical function calculates and returns the variance of a sample. It is also a replacement for the outdated VAR function. The variance provides a general idea of the spread of data, and can be used to calculate the standard deviation or determining risks of investment. In this guide, we’re going to show you how to use the VAR.S function and also go over some tips and error handling methods.
Supported versions
- Excel 2010 and newer versions
VAR.S Function Syntax
VAR.S(number1,[number2],...)
Arguments
| number1 | The first number argument corresponding to a sample of a population. | |
| [number2], ... |
|
VAR.S Function Example
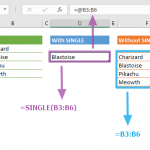
The VAR.S function accepts numeric values as its arguments. Text and logical values are ignored. You can use range references or static values like in any other formula.
The function calculates the variance using the following function:

- x: sample mean (average)
- x ̅: sample element
- n: sample size
Here is the comparison of the two approaches:
=VAR.S(sample)
=SUMPRODUCT(POWER(AVERAGE(sample)-sample,2))/(COUNT(sample)-1)
The formulas using named range sample (B5:B9).

VAR.S Function Tips
- The VAR.S function assumes that its arguments are a sample from a population. If your data represents the entire population, use VAR.P.
- The VAR.S function ignores text and logical values like TRUE and FALSE. If you want to evaluate text values and FALSE into 0 and TRUE to 1, check out VARA function instead.
- Empty cells are ignored.
- Prefer using VAR.S instead of the outdated VAR function.
Issues
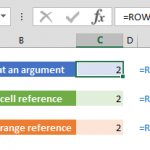
- Any error in the arguments causes the function returns an error.