Moving average calculations is a common way of smoothing data to reduce the effects of random, short-term fluctuations. In this guide, we’re going to show you how to calculate simple moving averages in Excel using three methods.
What is Simple Moving Average (SMA)?
As the name suggests, this is the simplest form of a moving average. You can calculate SMA by taking the arithmetic mean of the previous set of values over a specified period.
The formula of SMA is:

where:
n = Time period
A = Data point in last n period
For example, to calculate a moving average for 3 values, you need to find the average of previous 3 values including the corresponding value.

Calculating simple moving average by AVERAGE Function
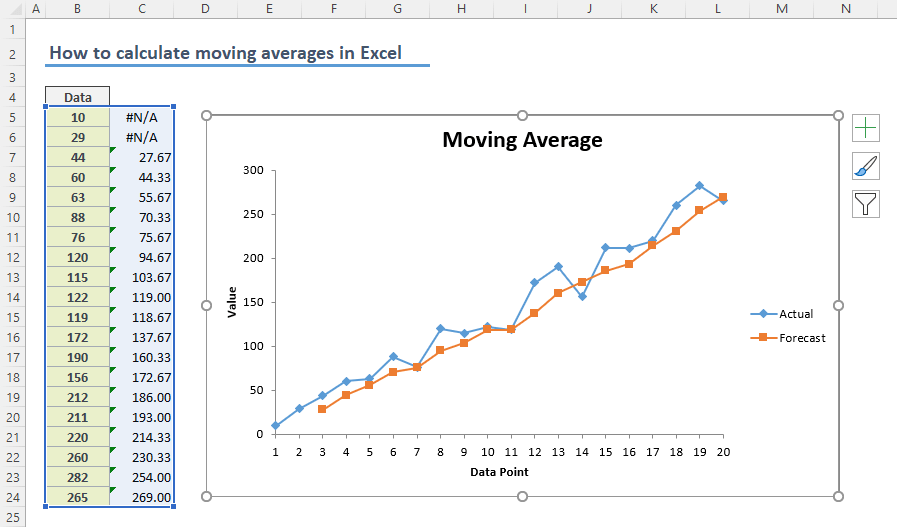
Because SMA refers the average of previous data points, you can use the AVERAGE function. Let's say we have a data set of values in column and want to calculate moving averages by 3 data points.
Select the cell near the 3rd value and type the formula with the AVERAGE function referring the first 3 values.

Next step is to copy the formula down along with data. The important point is to avoid using $ signs in the range reference to keep the range relative. Excel adjusts relative references based on the formula cell's location. Thus, you do not need to update your formula each time.

Simple moving average on an Excel chart
If all you want to do is to show moving averages on your chart and you do not want to spend time on calculations, there is a quicker way. Excel charts can generate a simple moving average line automatically.
Start by inserting a chart.

Once the chart is created, use the Add Elements, the plus (+), button near the chart and click More Options item under Trendline category. This action will display the format Trendline section in the properties pane.

Select Moving Average under Trendline Options and set the desired period. Optionally, you change auto-generated name under Trendline Name.

Using Analysis ToolPak
The final approach is to use the Analysis ToolPak add-in of Excel. This add-in includes lots of tools for statistical calculations.
Start by enabling the add-in if you haven't used it before (the add-in comes disabled by default).
- Open Excel Options by following File > Options.
- Open the Add-ins tab.
- Make sure that Excel Add-ins is selected in the Manage dropdown.
- Click the Go button to open Add-in dialog.

- Mark the Analysis ToolPak item.
- Click OK to enable the add-in.


You can find its icon under the Data tab > Data Analysis.

Clicking the icon opens Data Analysis dialog with a list of tools available. Select Moving Average item and press OK.

Fill in the inputs in the Moving Average window according to your data and click OK to calculate simple moving average.
Input Range: Range of data you want to calculate. (B4:B24)
Labels in the first row: Enable this option if the first row includes a title like ours.
Interval: Time period.
Output Range: Range where you want the moving average values to be populated.
Chart Output: Enable this if you want Excel to generate a chart.
Standard Errors: Enable this if you want Excel to calculate standard errors.

The downside of this approach is the lack of auto updates. Thus, you need to follow the steps each time you update the data.