In this article, we are going to show you how to create a 3D Map in Excel.
What is a 3D Map?
3D Maps were first introduced as part of Power Maps as an add-in for Excel 2013. Along with Power Query. Power Maps can be useful for reporting purposes. In versions 2016 and newer, 3D Maps are native part of the Excel.
Excel supports 3 map types:
- 3D Maps
- Map charts
- Bing Maps
The last two types are 2D maps and offer somewhat limited visualization options. On the other hand, they are a bit easier to create and use in dashboards with other elemenets. 3D Map tool takes its own window, and can't be combined with other tools.
Requirements
To create 3D maps, you first need to connect the Bing Map service. You can create a new map or append data into existing one only if you have an online connection. If you already have a map, you don’t need an internet connection to update it.
Next, you need to organize your data to be able to use it with 3D maps. A 3D Map can use names of geographical regions - like countries/regions, states, counties, or postal codes. For the best results, we recommend using geographic coordinates instead of names.
Each row of your data needs to contain information about a unique record, and the first row should include headers. Make sure that at least one column contains a geographical definition, such as the latitude/longitude pair or city, state, country, postal code, or the full address.
Convert your data into an Excel table format so that it can be recognized by 3D Maps. You can press Ctrl + T when any cell in your data table is selected. For more information about Excel tables: How to create an Excel Table.
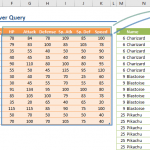
Here is a sample data:

Creating a 3D Map
Now, it is time to create a 3D Map. Follow the steps below:
- Click any cell in your data table
- Activate the Insert tab in the Ribbon
- Click the 3D Map icon in Tours section


You should now see the 3D Maps window where you can configure the map. At first, you might only see a square marker representing your data. To customize this, you need to add fields into 3D Maps in a similar manner with Pivot Tables.

If your data table contains a single category column with several numeric fields,, like in our example, you can move the numeric fields into the Height box. Each item will be visualized as a column on their corresponding location.

Use the Category section if your data has a column with multiple groups (similar to creating a pie chart).

Column chart is the default visualization type for 3D Maps. You can switch between other chart types by clicking on the icons from the right pane.

Chart options include the following:
- Clustered Column
- Stacked Column
- Bubble
- Heat Map
- Region
You can further customize your 3D map using Filters and Layer Options.
Tour
You can create videos of the earth turning using the Tour feature, and even add a music if you'd like.
To do this, first you need to add an effect to your map. Click on Screen Options in the toolbar and select an effect. Modify the Effect Speed according to your preference.

Click the Play Tour button to see the tour effect.


You can combine multiple effects by creating new scenes. Each scene can get different effects and properties. To play starting from the current scene you are working on, use the Play Tour from current Scene button.