Normal distribution is a probability function in statistics and is often used to represent real-valued random variables. It is known as the bell curve because normally distributed set of random numbers create a bell-shaped curve on a graph. In this guide, we're going to show you how to generate a normally distributed set of random numbers in Excel.
NORM.INV Function
The NORM.INV function is a statistical function of Excel which calculates the inverse of the normal cumulative distribution of a probability for a given mean (average) and standard deviation.
The function needs a probability value (x), arithmetic mean (mean), and standard deviation of the distribution (standard_dev). Since the mean and the standard deviation need to be consistent for the sample numbers, you need to provide a random probability (0-1) to generate a normally distributed set of random numbers.
You can use either the conventional RAND function or dynamic RANDARRAY function for random number generation. Although each function can return a random generated number between 0 and 1, the RANDARRAY can generate multiple numbers at a time. However, you need to be a Microsoft 365 subscriber to use the RANDARRAY function.
Here is the syntax for each formula:
=NORM.INV(RANDARRAY(<sample size>),Mean,StdDev)
To use the RAND function version, copy the cell into as many cells as you want to generate a normally distributed set of random numbers.
For the RANDARRAY version, just enter the sample size as its first argument.
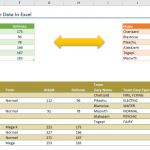
As you can see below, each approach generates similar numbers. The following screenshot shows random numbers generated for a population with a mean of 5 and standard deviation of 0.5.

Histogram Chart
You can test the numbers on a histogram chart to see whether they fit a normal distribution. To create a histogram chart, select the generated random numbers and follow the Ribbon path:
Insert > Insert Statistics Chart > Histogram

Note that a histogram chart gives better results with larger sample size.