Normalizing (or standardizing) is an essential step in analyzing large datasets. Finding the z-scores of a sample data based on the standard deviation and mean of the entire data set can help you achieve a more manageable workload. This is especially true for when comparing various sets of data. In this article, we are going to show you how to normalize data in Excel.
What Is Normalization?
Normalization in this case essentially means standardization. Standardization is the process of transforming data based on the mean and standard deviation for the whole set. Thus, transformed data refers to a standard distribution with a mean of 0 and a variance of 1.

In a normalized data set, the positive values represent values above the mean, and the negative values represent values below the mean. For example, +1 means that a particular value is one standard deviation above the mean, and -1 means the opposite.
Normalizing data in Excel
Excel has a function called STANDARDIZE which calculates and returns the normalized value from a distribution characterized by arithmetic mean and standard deviation. The function requires the arithmetic mean and standard deviation values from the user.
You can use the AVERAGE function to calculate the arithmetic mean (or average) of a data set.
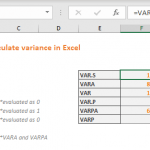
You mainly have two options for calculating the standard deviation of a data set based on the size of your data:
Let’s see how you can normalize data using these functions. Start by calculating the mean and standard deviation of the data set.

We named cells of calculated values as Mean and Std_Dev for STANDARDIZE function. You can use the function for any x value in your dataset. If you want to standardize entire data set, follow the instructions below.
Continue by adding a column to near your dataset. Adjacent columns allow autofill to help formula populating.
Enter a formula similar to this and copy it down to the column:

These numbers represent the number of standard deviations in a given data point is from the mean. A negative z-score shows a value less than the mean, and a positive z-score shows a value greater than the mean. The average of z-score for a data set is zero (0).